With 7+ years of experience in business intelligence, data modeling, and process automation, I am adept at transforming complex data into actionable insights. I combine exceptional problem-solving with technical expertise and human-centered design principles. I am currently growing my expertise through active participation in technical communities while seeking opportunities in data visualization and automation.
Selected Projects
(Click images to enlarge)
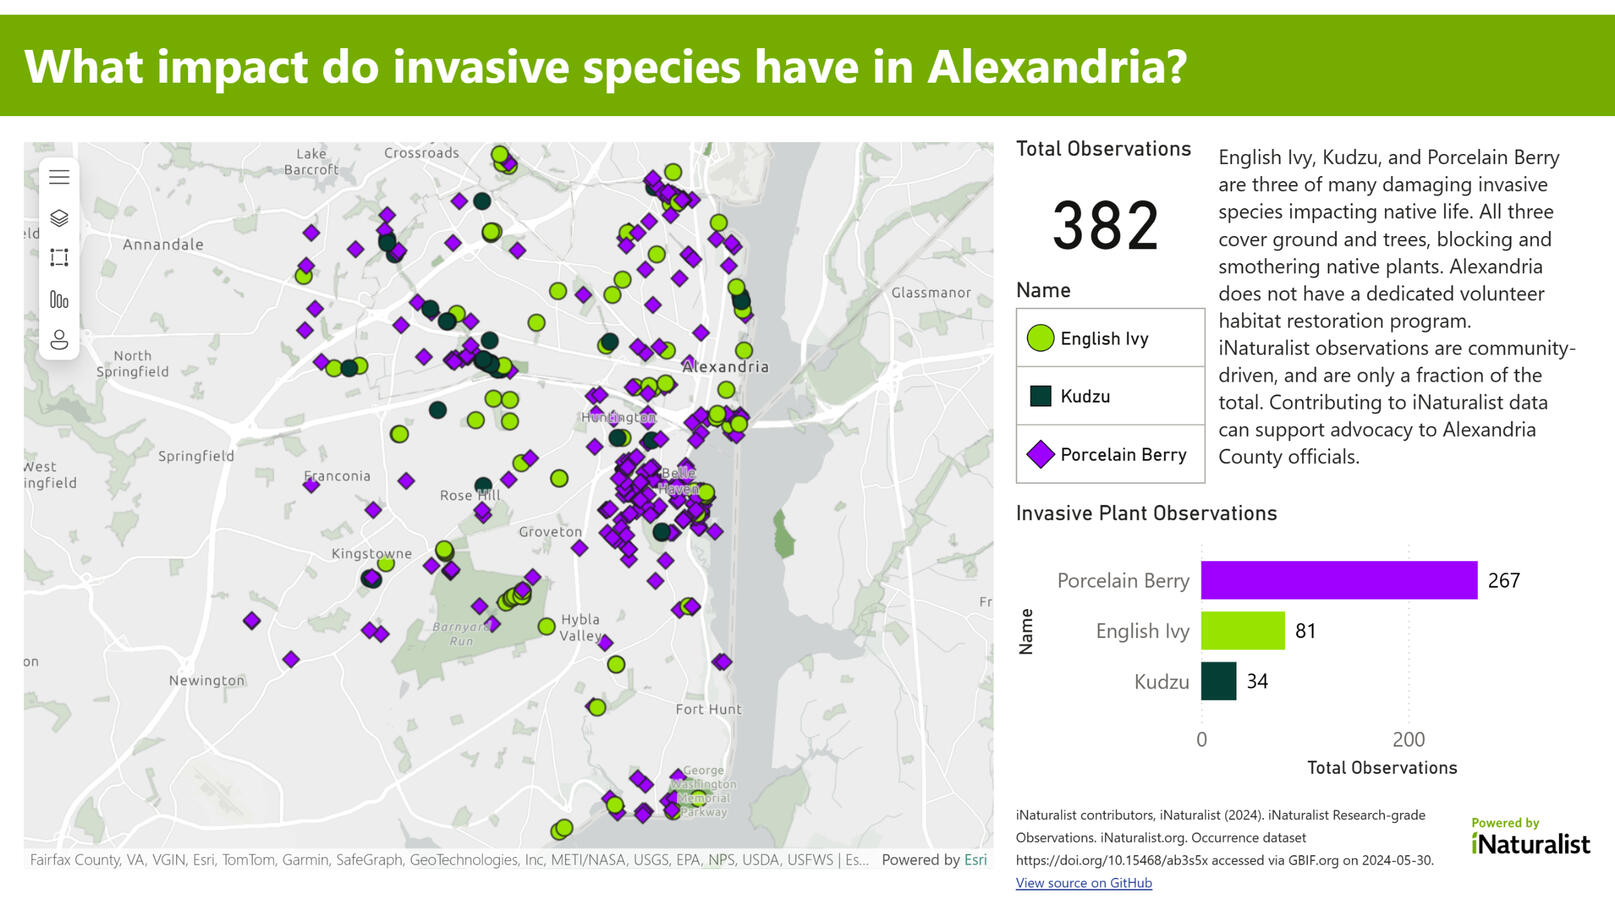
Visualizing Invasive Species in Alexandria - Github
A project inspired by my own interests in conservation and invasive species control. I selected three species with similar issues, and mapped out their spread in Alexandria using data from iNaturalist.
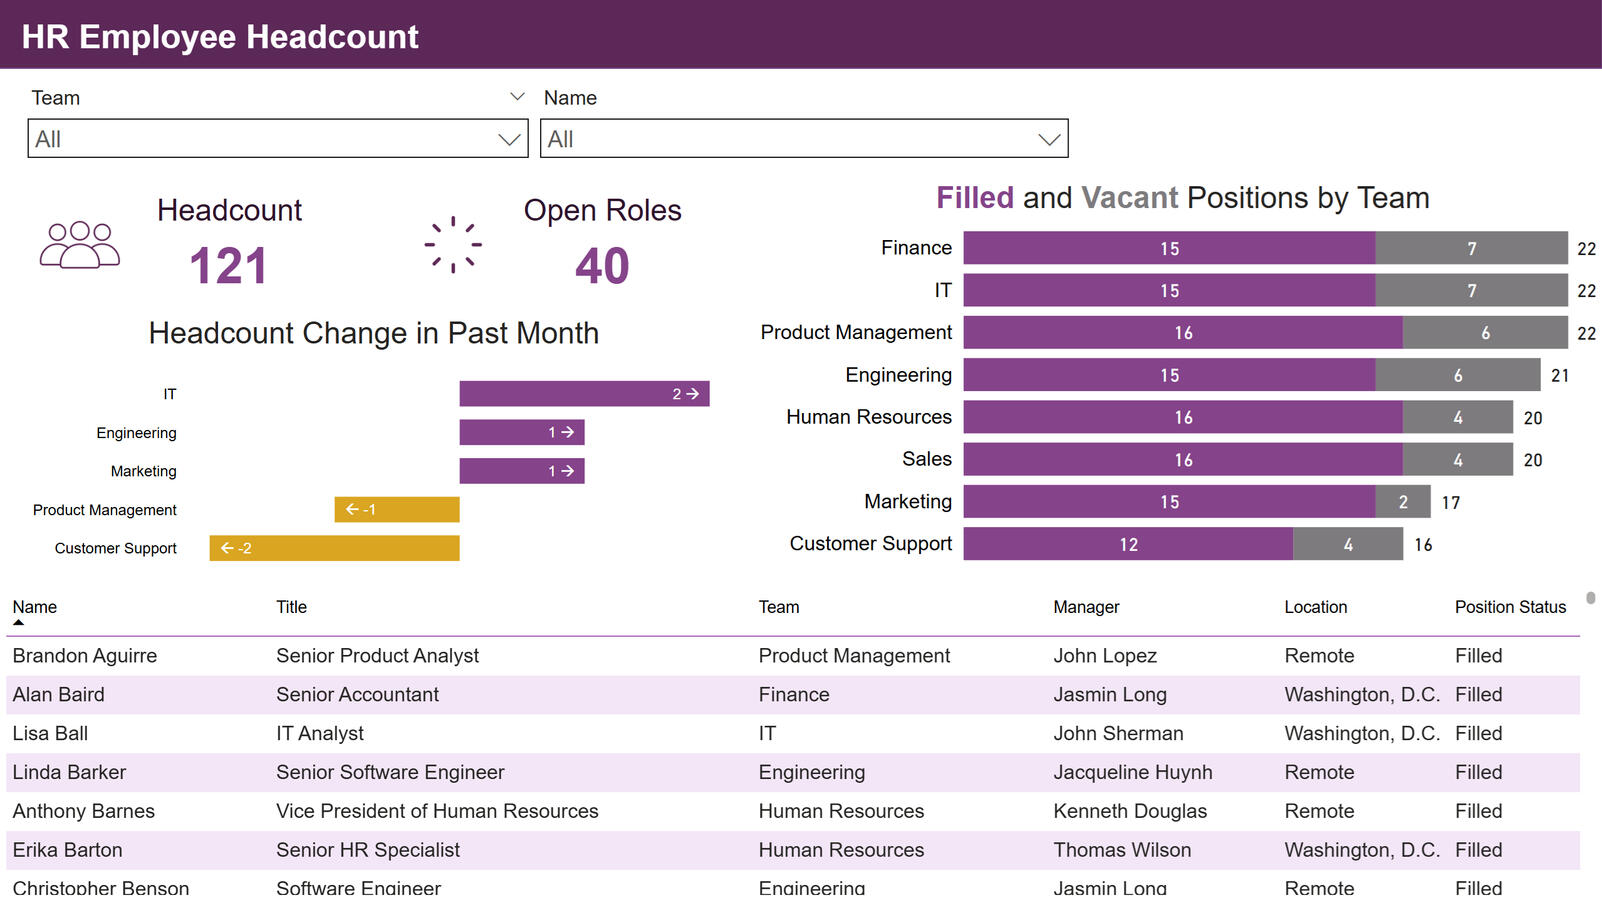
HR Employee Headcount - Report View
An anonymized version of a report created for a client to help analyze employee headcount and position vacancies, alongside being able to view organization hierarchies.
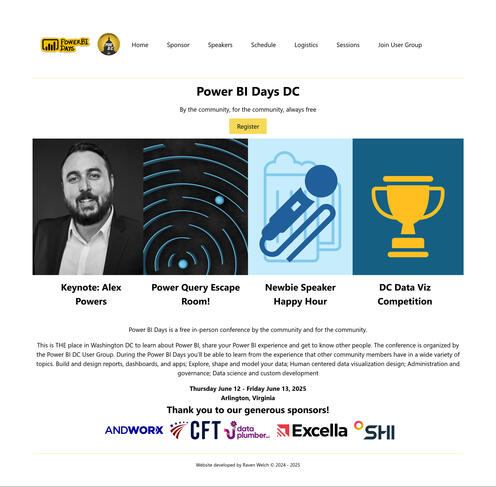
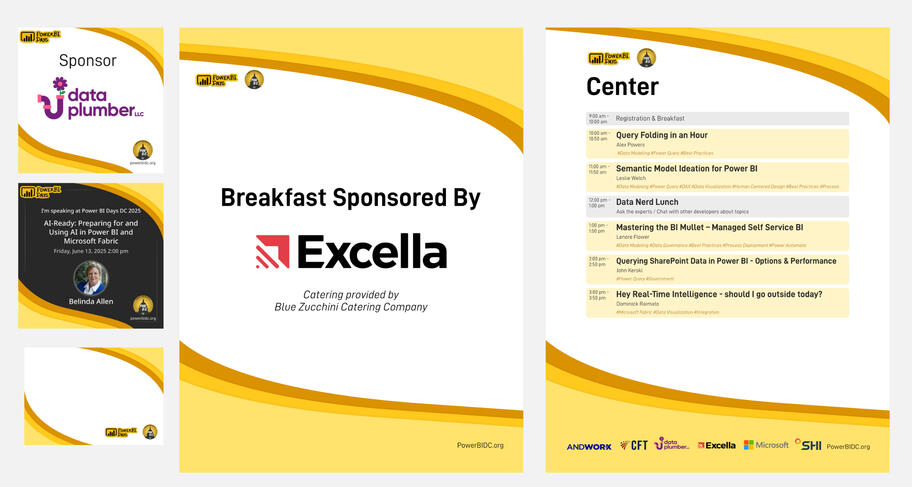
Power BI Days DC - powerbidc.org
As an active member of the Power BI DC User group, I volunteered to support Power BI Days DC in both 2024 and 2025. I developed their website both years, and designed all conference materials in 2025 including speaker badges, signage, and more. I also provided onsite assistance for this community organized two-day conference that brings top notch speakers to DC to Power BI DC members free of charge.
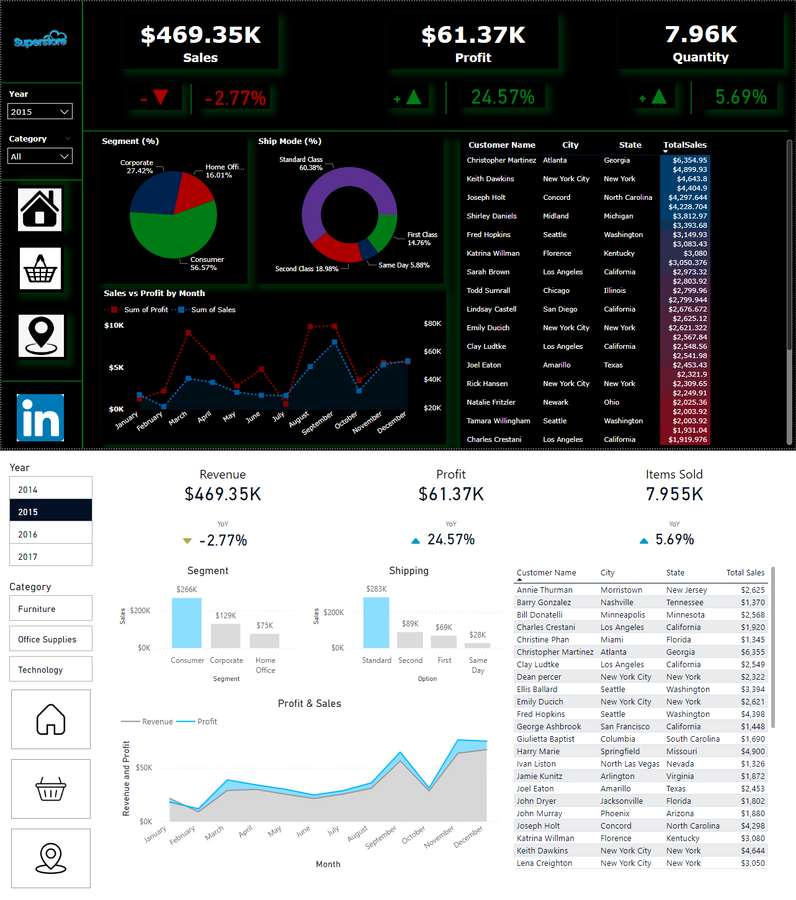
Power BI Project Makeover
Taking a project published to the Power BI data stories gallery, I created a visual makeover. The goals were to reduce visual noise, select charts that are easy to understand, eliminate issues that cause charts to be misleading, change colors to make them accessible to users with color-blindness or visual impairment, and renamed labels for clarity.
Technical Writing
A selection of technical writing created while completing the Data Science course at Flatiron School.
KickSmarter - Flatiron Keystone Project
My final project for the Flatiron Data Science program, analyzing the success rates of funding Kickstarter projects and outlining the potential of creating a tool to increase the likelihood of a project's success.
An Intro to Customizing Charts in Plotly Express
An introduction to creating and customizing charts using Plotly Express
Taking on T-Tests with SciPy
An overview of T-Tests in SciPy, how they work, and how to do them.
Cleaning Arlington Income Data with Pandas (private article)
An article following my process of cleaning census data.
